


The Hidden Cost of Cutting Solar Maintenance: A USD 15,000 Lesson


Solar PV is often considered a low-maintenance asset. But reducing maintenance without understanding its impact on performance can create losses far greater than the cost saved.
This case study demonstrates how delayed maintenance contributed to an estimated 11% annual performance loss (~USD 15,000) within a single year—and why maintenance decisions should be evaluated against the revenue they protect.
The case involves a 600 kWp rooftop solar PV system commissioned in Q2 2023 at a manufacturing facility in a high-pollution industrial environment. Approximately 30% of the system was also exposed to emissions from the facility's own manufacturing processes, increasing the risk of accelerated soiling.
Like many C&I asset owners, the customer's primary focus was its core business. As long as the inverter monitoring portal showed that the system was operating and no major alarms were reported, there was little reason to suspect a problem. Without dedicated performance analytics, however, gradual reductions in generation could not easily be distinguished from weather variation, seasonal effects, or an underlying performance issue.
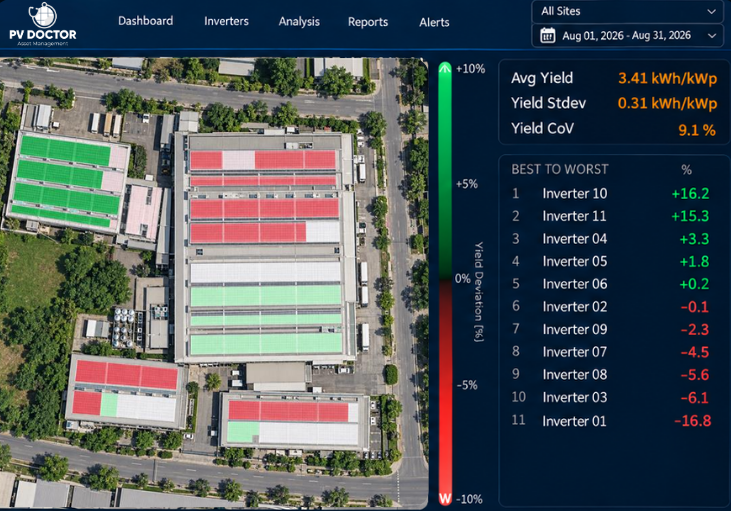
Figure 1: PV Health Scan - inverter daily spatial heatmap identifying underperforming areas
PV Doctor's performance analytics identified a persistent reduction in generation that could not be explained by weather conditions alone. The PV Health Scan further revealed spatial differences across the rooftop, highlighting specific areas requiring investigation.
On-site inspection and AI-assisted aerial thermal imaging were subsequently used to validate the findings. The investigation identified excessive module soiling and seasonal partial shading as the principal loss mechanisms.
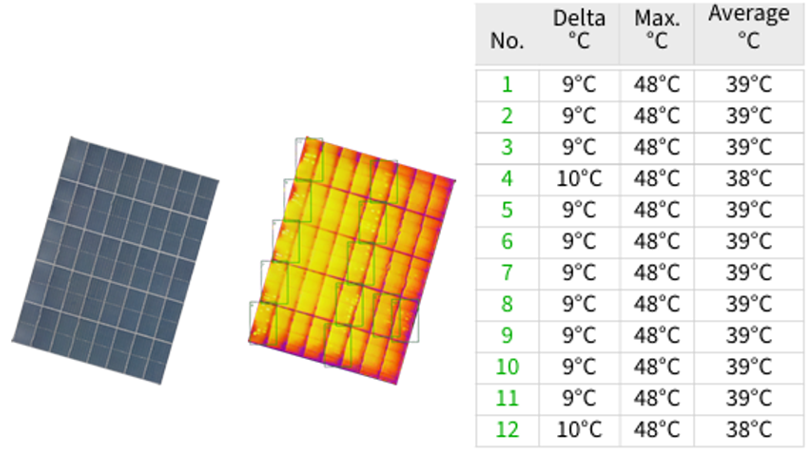
Figure 2: AI-assisted Thermal Aerial Inspection for Hotspot Detections
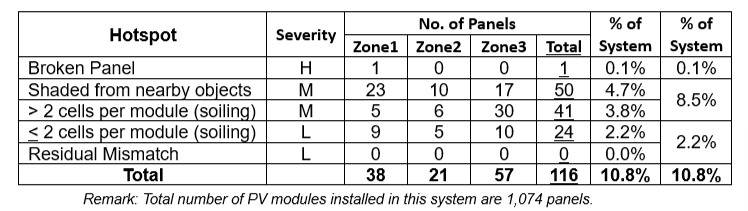
Table 1: Summary of Thermal Inspection Findings - Affected PV Modules
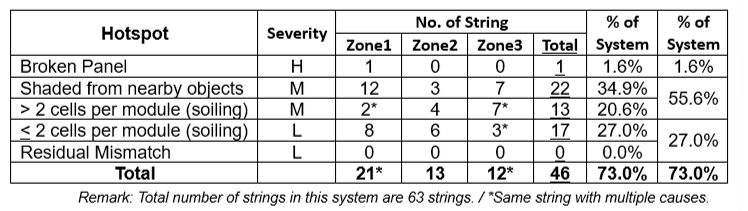
Table 2: Summary of Thermal Inspection Findings - Affected PV Strings
Although thermal anomalies were observed on only 10.8% of modules, the affected modules were distributed across 73% of PV strings. Because modules within a string operate together, relatively localised issues can influence a much larger proportion of system generation.
PV Doctor's analytics quantified the major loss mechanisms, providing the basis for prioritising corrective actions according to their energy and financial impact.
- Estimated Annual Performance Loss: 11%
- Estimated Soiling Loss: 5%
- Estimated Shading Loss: 6%
These quantified losses provide the technical basis for evaluating maintenance priorities and estimating the financial benefit of corrective actions.
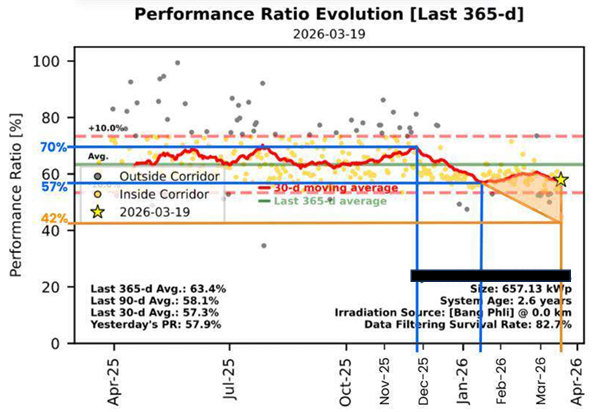
Figure 3: Performance Ratio (PR) Evolution and Projected No-Clean Scenario
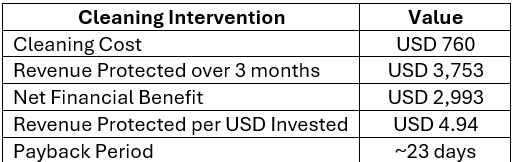
Table 3: Financial Evaluation of the Cleaning Intervention (3-Month Period)
The cleaning intervention required approximately USD 760 in maintenance expenditure. Over the following three months, the system generated an estimated USD 3,753 in recovered electricity revenue compared with the projected no-clean scenario.
After deducting the cleaning cost, this resulted in a net financial benefit of approximately USD 2,993.
The comparison demonstrates the financial leverage of relatively small maintenance expenditure.
Every USD 1 invested in cleaning protected approximately USD 5 in electricity revenue.
In this case, the cleaning cost was therefore not simply an O&M expense—it was an investment in protecting the asset's energy revenue.
Following the assessment, the owner implemented the recommended cleaning programme and onboarded the site to PV Doctor Smart O&M for continuous performance monitoring.
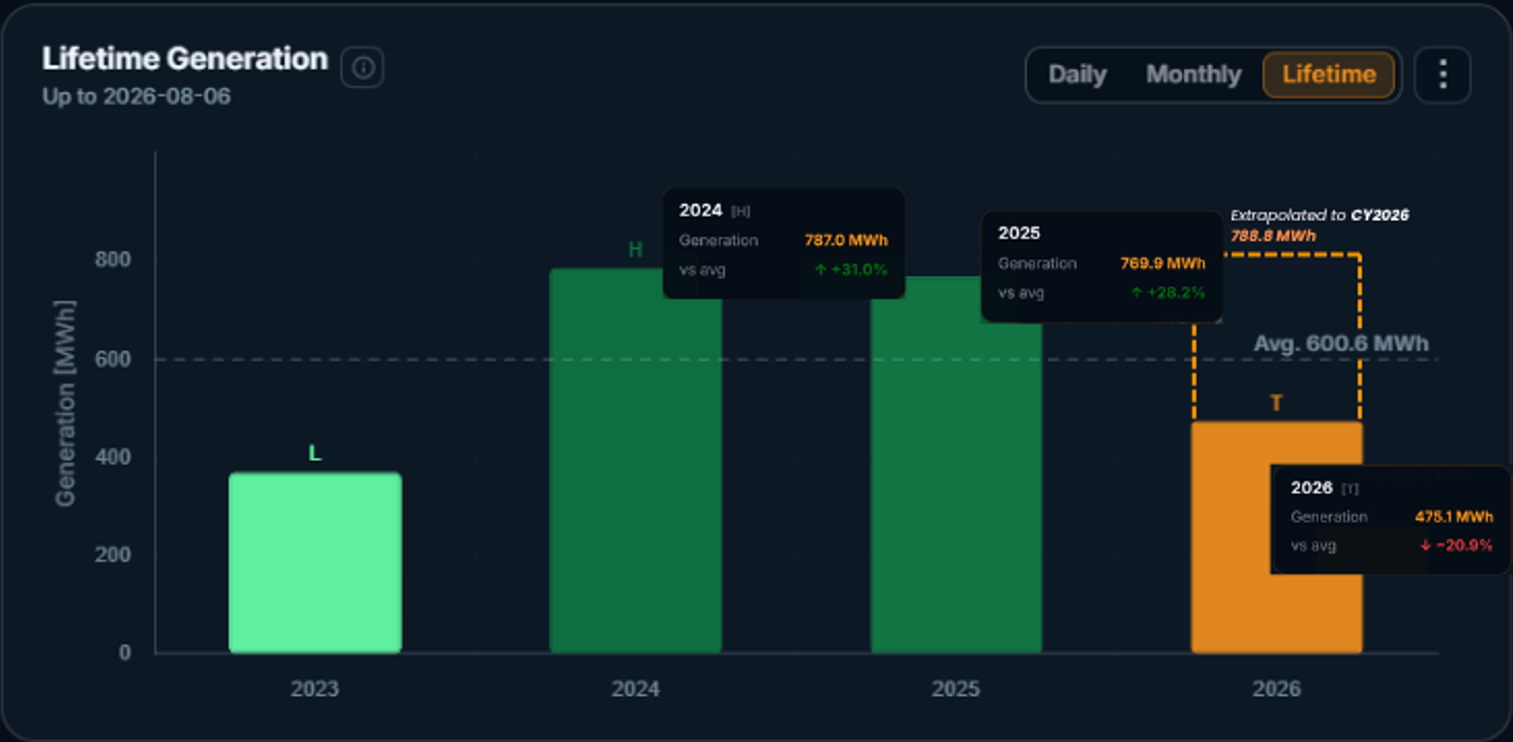
Figure 4: Annual Energy Generation Before and After Performance Optimisation
Performance stabilised following cleaning. After two recommended cleaning cycles, weather-normalised CY2026 generation is projected to reach approximately 789 MWh—the site's highest annual generation since commissioning.
Looking at annual generation, 2024 was 787 MWh, then dropped to 770 MWh, which was 2.2%. After subscribed to PV Doctor and followed 2 cleaning cycle suggestions, based on weather-normalised performance, the system is projected to close CY2026 at ~789 MWh, its highest annual generation.
The objective of solar O&M should not be to minimise maintenance expenditure. It should be to maximise the financial return of the asset.
In this case, a relatively small maintenance expenditure protected several times its cost in electricity revenue. Cutting cleaning frequency may reduce an O&M budget on paper, but without understanding the corresponding generation loss, it can reduce overall profitability.
The right question is therefore not simply:
"How much does cleaning cost?"
The more important question is:
"How much revenue does that cleaning protect?"
PV Doctor is a Smart O&M platform that helps solar asset owners identify, quantify, and prioritise performance losses. By combining continuous performance analytics with technical expertise, PV Doctor turns operational data into actionable maintenance decisions.